The rise of big data has led to an explosion in visualizations used in news articles and scientific papers. In particular, there’s been growing interest in interactive visualizations that allow readers to dig into the data themselves.
The problem is that building such graphics can take a lot of time and energy, and there’s no one-size-fits-all approach to automatically generating visualizations.
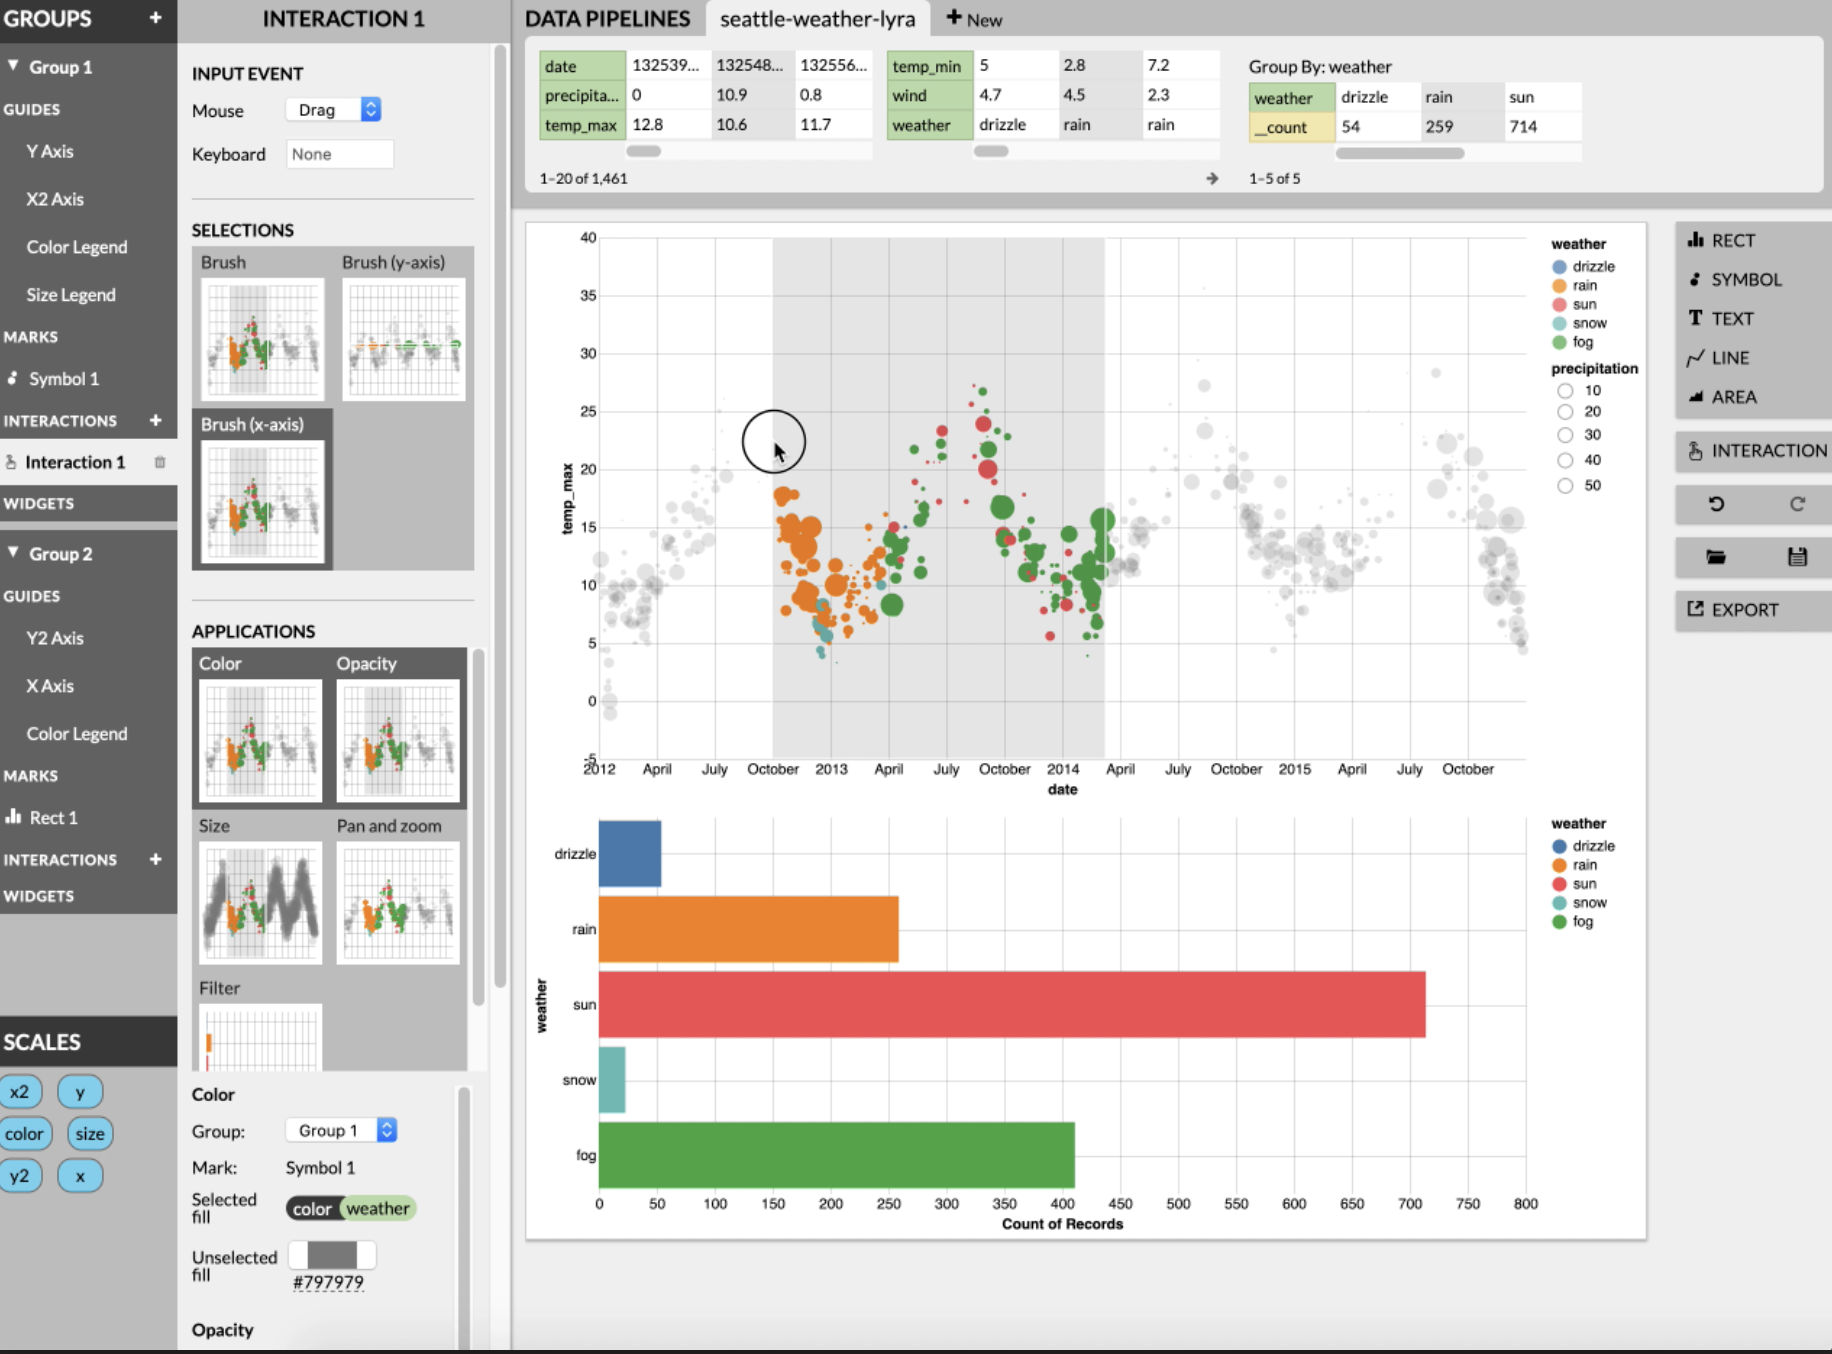
A team from MIT CSAIL is working on this issue with a new tool called Lyra 2 that allows you to rapidly develop custom interactive data visualizations without having to write a single line of code. Users simply have to click, drag or key-press directly on their visualization to make changes to it.
Researchers found that, after providing a 10-minute walkthrough of Lyra 2’s features, users could easily create a range of different interactive visualizations. The team has made the system available online for anyone to try out.
“Lyra 2 represents only the first step in developing non-textual mechanisms for authoring interactivity in data visualizations,” says PhD student Jonathan Zong, lead author on a paper about the project. “We next want to explore how to support designing more custom interactions by demonstration, especially those that are not selection-based.”
Zong co-wrote the paper with MIT professor Arvind Satyanarayan, visiting undergraduate Dhiraj Barnwal and MIT undergraduate Rupayan Neogy. He will be presenting it this week, at the Computation and Journalism Symposium being hosted by Northeastern University.