Today’s world is one big maze, connected by layers of concrete asphalt that afford us the luxury of navigation by vehicle. For much of our road-related advancements - GPS lets us fire fewer neurons thanks to map apps, cameras alert us to potentially costly scrapes and scratches, and electric autonomous cars have lower fuel costs - our safety measures haven’t quite caught up. We still rely on a steady diet of traffic signals, trust, and the steel surrounding us to safely get from point A to point B.
To get ahead of the uncertainty inherent to crashes, scientists from MIT’s Computer Science and Artificial Intelligence Laboratory (CSAIL) and the Qatar Center for Artificial Intelligence (QCAI) developed a deep learning model that predicts very high-resolution crash risk maps. Fed on a combination of historical crash data, road maps, satellite imagery, and GPS traces, the risk maps describe the expected number of crashes over a period of time in the future, to identify high-risk areas and predict future crashes.
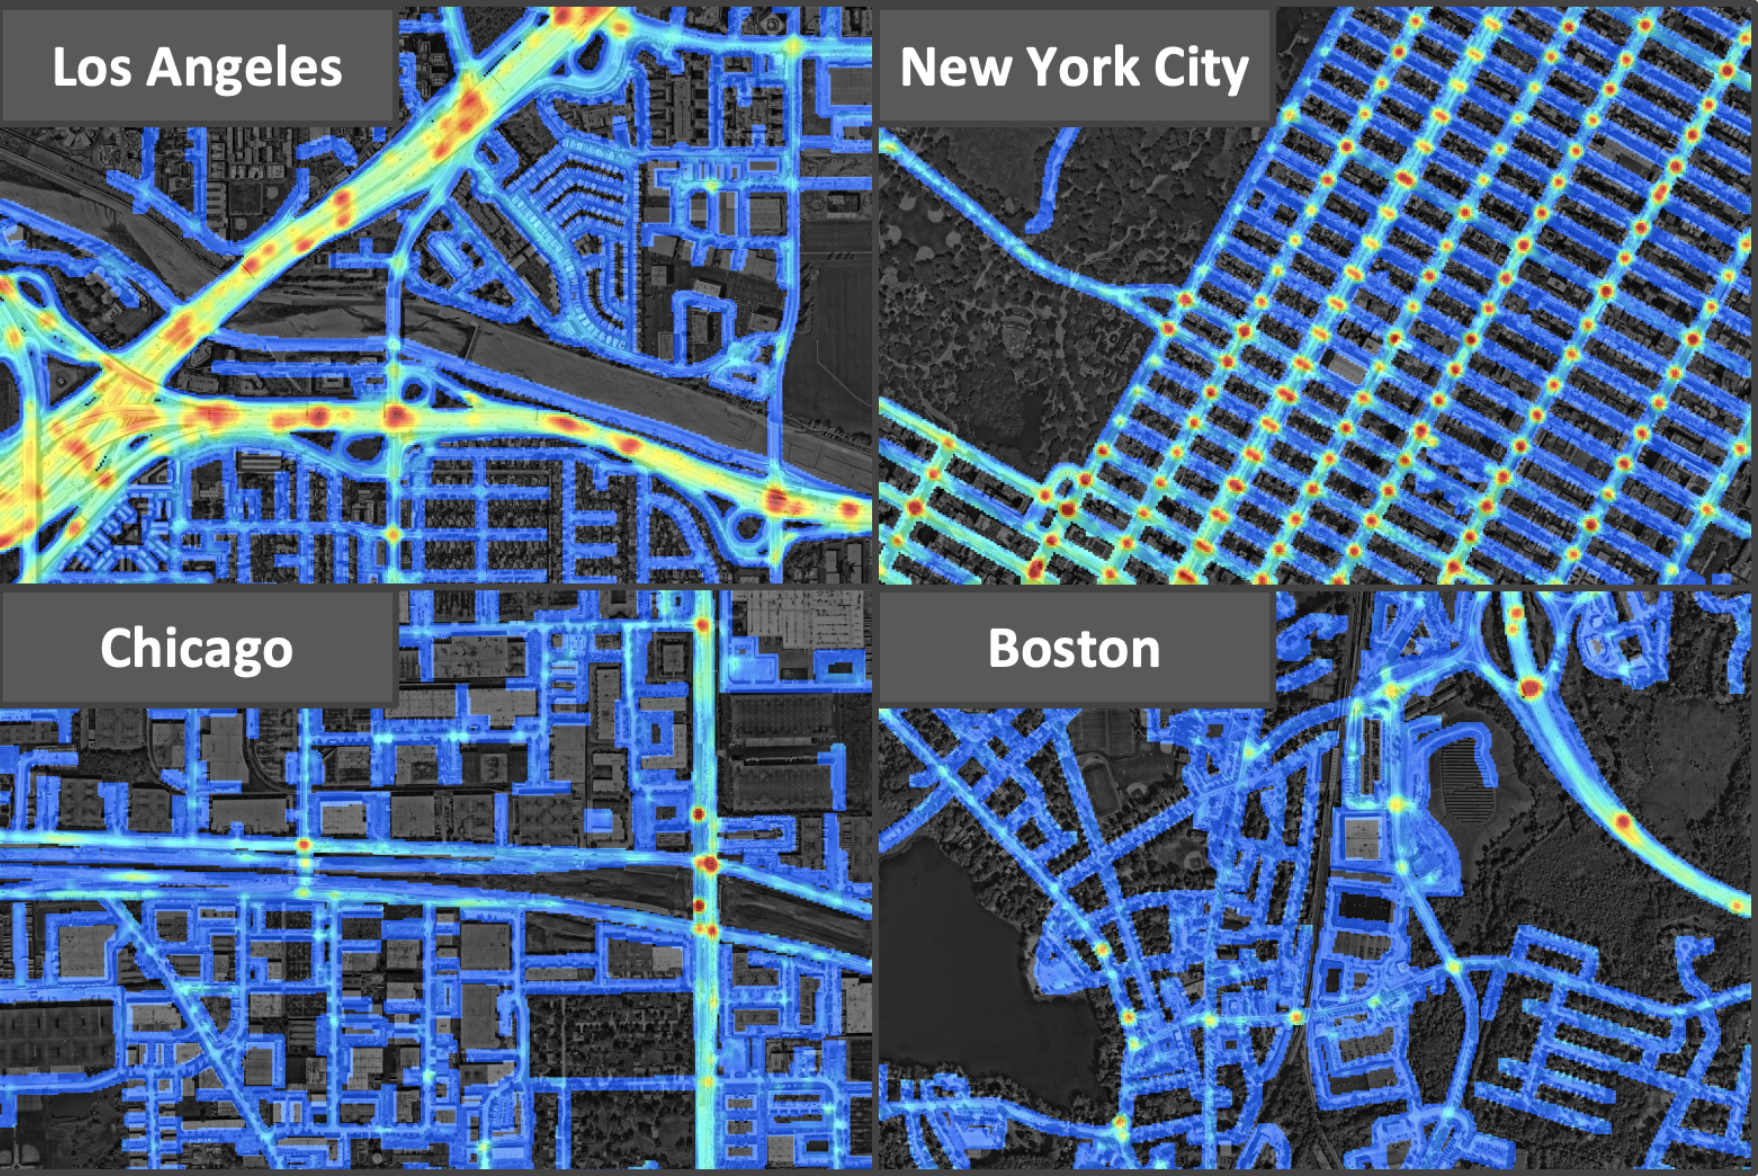
Typically, these types of risk maps are captured at much lower resolutions that hover around hundreds of meters, which means glossing over crucial details since the roads become blurred together. These maps, though, are at five by five meter grid cells, and the higher resolution brings newfound clarity: the scientists found that a freeway road, for example, has a higher risk than nearby residential roads, and ramps merging and exiting the freeway have an even higher risk than other roads.
"By capturing the underlying risk distribution that determines the probability of future crashes at all places, and without any historical data, we can find safer routes, enable auto insurance companies to provide customized insurance plans based on driving trajectories of customers, help city planners design safer roads, and even predict future crashes,” says MIT CSAIL PhD student Songtao He, a lead author on a new paper about the research.
Even though car crashes are sparse, they cost about three percent of the world’s GDP, and are the leading cause of death in children and young adults. This sparsity makes inferring maps at such a high-resolution a tricky task. Crashes at this level are thinly scattered - the average annual odds of a crash in a five by five grid cell is about one in one thousand - and they rarely happen at the same location twice. Previous attempts to predict crash risk have been largely “historical,” as an area would only be considered high-risk if there was a previous nearby crash.
The team’s approach casts a wider net to capture critical data necessary. It identifies high-risk locations using GPS trajectory patterns, which give information about density, speed and direction of traffic, and satellite imagery which describes road structures, such as the number of lanes, whether there’s a shoulder, or if there’s a large number of pedestrians. Then, even if a high-risk area has no recorded crashes, it can still be identified as high-risk, just based on its traffic patterns and topology.
To evaluate the model, the scientists used crashes and data from 2017 and 2018, and tested its performance at predicting crashes in 2019 and 2020. Many locations were identified as high-risk, even though they had no recorded crashes, and also experienced crashes during the follow-up years.
“Our model can generalize from one city to another by combining multiple clues from seemingly unrelated data sources. This is a step toward general AI because our model can predict crash maps in uncharted territories,” says Amin Sadeghi, a lead scientist at Qatar Computing Research Institute (QCRI) and author on the paper. “The model can be used to infer a useful crash map even in the absence of historical crash data, which could translate to positive use for city planning and policy making by comparing imaginary scenarios.”
The dataset covered 7,500 square kilometers from Los Angeles, New York City, Chicago and Boston. Among the four cities, LA was the most unsafe, since it had the highest crash density, followed by New York City, Chicago and Boston.
“If people can use the risk map to identify potentially high-risk road segments, they can take action in advance to reduce the risk of trips they take. Apps like Waze and Apple Maps have incident feature tools, but we’re trying to get ahead of the crashes -- before they happen,” says He.
He and Sadeghi wrote the paper alongside Sanjay Chawla, Research Director at QCRI, and MIT professors Mohammad Alizadeh, Hari Balakrishnan, and Sam Madden. They will present the paper at the 2021 International Conference on Computer Vision.