
CSAIL principal investigator Ruth Rosenholtz was on Science Friday today to discuss her research applying computer-vision techniques to transit maps. Her computer models are capable of determining how well people will comprehend a subway map (or other complex visualizations) in a single glance.
From Science Friday:
It might just be the greatest graphic design challenge of all: How do you straighten out the spaghetti bowl that is the London Tube, Paris Metro, or New York City Subway to make an easy-to-use transit map? The question has real implications for millions of transit riders across the globe, and increasingly, researchers suggest that psychology and cognitive science could help provide designers with useful data about what works—and what doesn’t—in map design. MIT’s Ruth Rosenholtz and the University of Essex’s Max Roberts join Ira Flatow to talk about a few of the methods they’ve developed to put transit maps to the test. Rosenholtz describes how she visualizes what transit maps might look like in peripheral vision, and Roberts explains why he made the NYC Subway map a circle.
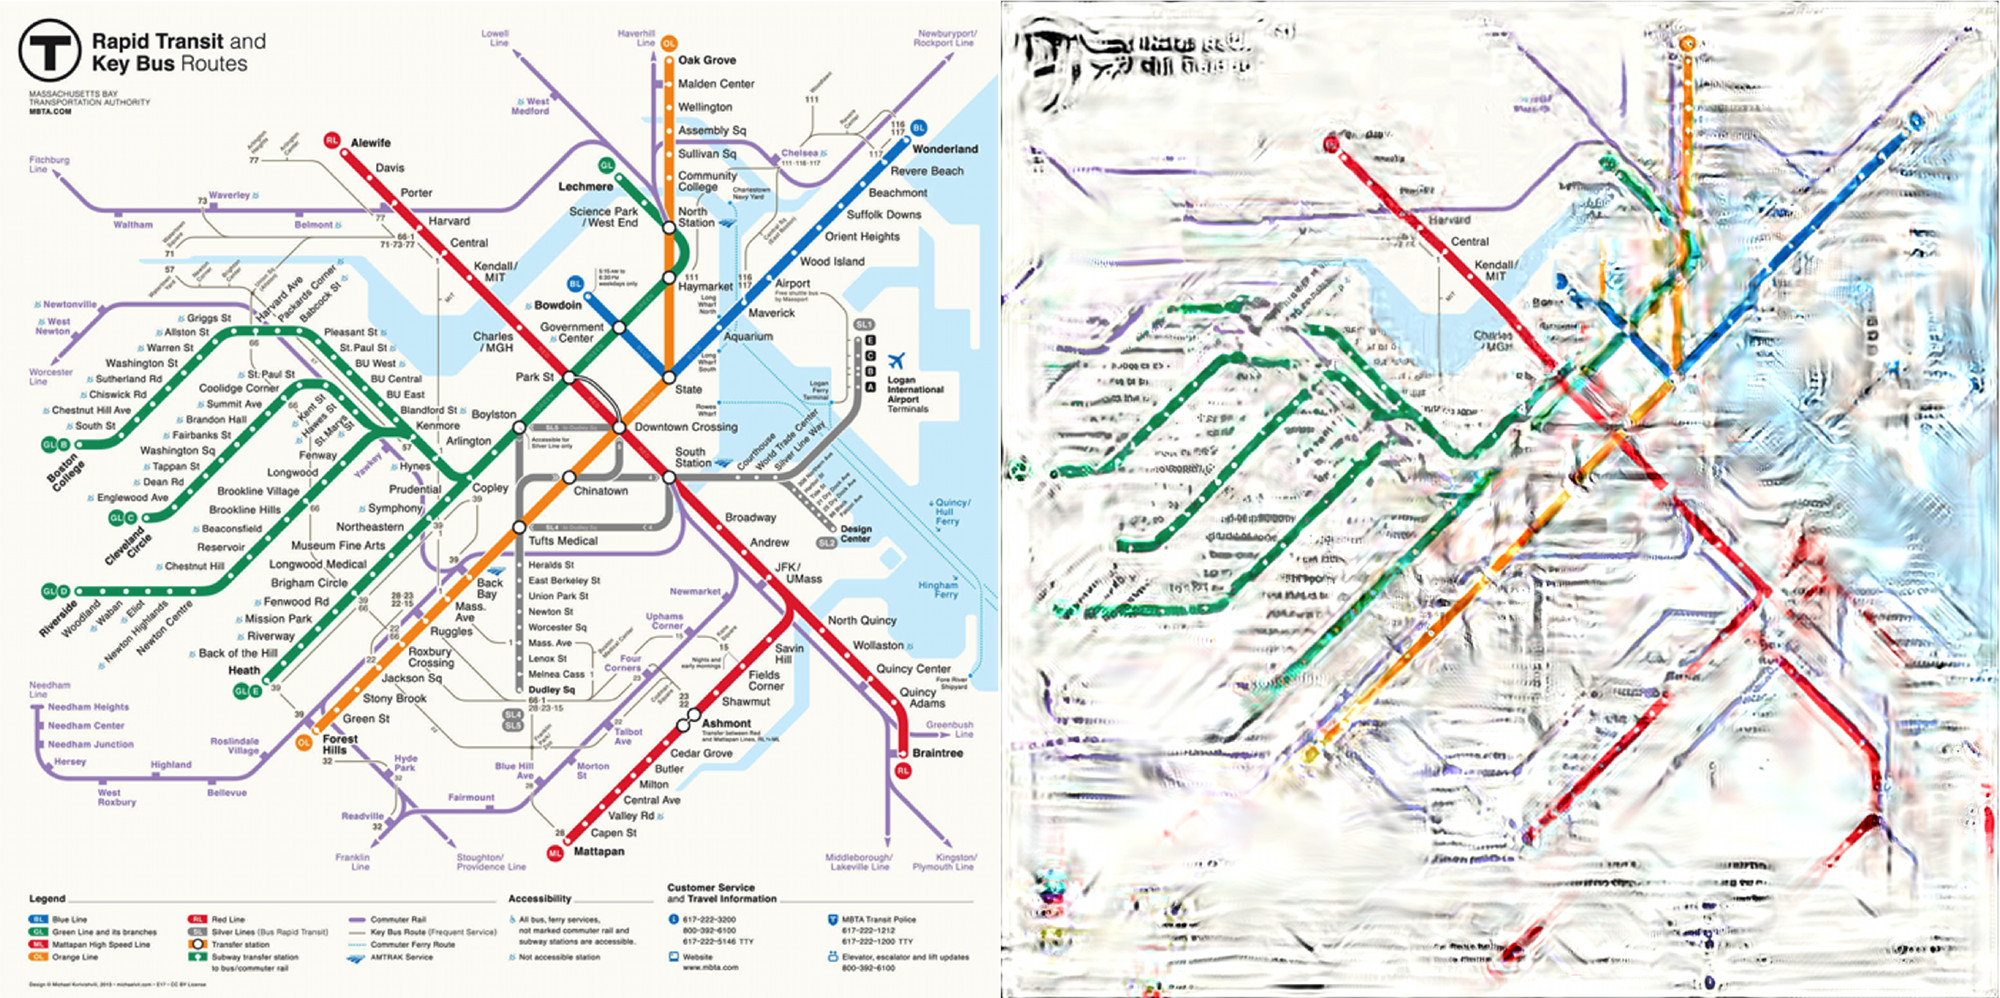
Boston’s MBTA T map (L) and what it may look like in peripheral vision (R) (with a focus on the Kendall/MIT stop). Courtesy of Ruth Rosenholtz